Tutorial: Running McMini
Exploring McMini’s search algorithm
Given that McMini tries to do aggressive pruning of branches, in order to
reduce the search, it may be intellectually interesting to explore where
McMini does pruning. For this exercise, we will use the -v flag.
We’ll again visit a trivial mutex program. Copy the following program
into a file, one-mutex.c, and compile it. (Don’t forget
the -pthread flag when compiling.)
#include <stdio.h>
#include <pthread.h>
pthread_mutex_t mutex = PTHREAD_MUTEX_INITIALIZER;

void *child_thread(void *dummy) {
  pthread_mutex_lock(&mutex);
  printf("child: I locked the mutex!\n");
  pthread_mutex_unlock(&mutex);
  return NULL;
}

int main() {
  pthread_t thread;
  pthread_create(&thread, NULL, child_thread, NULL);
  pthread_mutex_lock(&mutex);
  printf("parent: I locked the mutex!\n");
  pthread_mutex_unlock(&mutex);
  pthread_join(thread, NULL);
  printf("*** Done.\n");
  return 0;
}
When we run it (./mcmini ./one-mutex), McMini reports two
traces. This shows that McMini searches two branches, based on whether
the parent or the child locks the mutex first. We can see this explicitly
by running
./mcmini -v ./one-mutex (to see the two trace sequences).
For a detailed analysis, one can run
./mcmini -t 0 -v ./one-mutex
or:
./mcmini -t 1 -v ./one-mutex.
(And we could run “./mcmini -v -v ./one-mutex” to see both traces in the same command.)
For an example output, we show here only the first case:
./mcmini -t 0 -v ./one-mutex
About to exec into ./one-mutex
parent: I locked the mutex!
child: I locked the mutex!
*** Done.
TraceId 0:  0, 0, 0, 0, 1, 1, 1, 1, 0,
Trace process with traceId `0` exited with status 0
*** -t or --trace requested.  Printing trace:
THREAD BACKTRACE
 1. thread 0: starts
 2. thread 0: pthread_create(thr:1, _, _, _)
 3. thread 0: pthread_mutex_lock(mut:1)
 4. thread 0: pthread_mutex_unlock(mut:1)
 5. thread 1: starts
 6. thread 1: pthread_mutex_lock(mut:1)
 7. thread 1: pthread_mutex_unlock(mut:1)
 8. thread 1: exits
 9. thread 0: pthread_join(thr:1, _)
0, 0, 0, 0, 1, 1, 1, 1, 0,
END
THREAD PENDING OPERATIONS
 * thread 0: exits [ Done ]
   thread 1: exits [ Done ]
END
***** Model checking completed! *****
Number of traces: 1
And while it is overkill here, we may prefer to use ‘mcmini-annotate’ for a more detailed overview with line numbers from the original source code. (NOTE: To use mcmini-annotate, below, you must have first compiled McMini with ‘-g3’. If not, you can quickly re-compile with: make clean && make -j8 debug )
We can invoke ‘mcmini-annotate’ either either as:
> ./mcmini-annotate -t '0, 0, 0, 0, 1, 1, 1, 1, 0,' ./one-mutex
or more simply, pass on the original flags as given by ‘mcmini’:
> ./mcmini-annotate -t 0 ./one-mutex
They both yield:
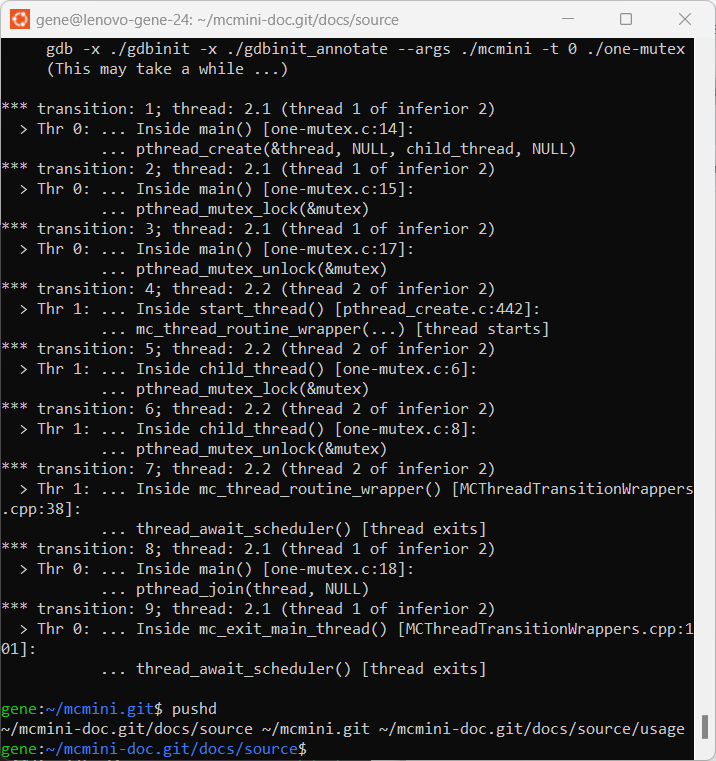
Finally, let’s look at all the traces (two traces, in this case).
> ./mcmini -q -v ./one-mutex
TraceId   0:  0, 0, 0, 0, 1, 1, 1, 1, 0,
Trace process with traceId `0` exited with status 0
TraceId   1:  0, 0, 1, 1, 1, 0, 0, 1, 0,
Trace process with traceId `1` exited with status 0
***** Model checking completed! *****
Number of traces: 2
There are only two traces because McMini was able to
determine that pthread_mutex_unlock() was independent of
all other thread operations. Only the owner of a mutex can call
pthread_mutex_unlock() on that mutex. So, the two traces
represent whether Thread 0 or Thread 1 locks the
mutex first.
Exploring mcmini-gdb: integration with GDB
Once McMini has reported a deadlock, we have two tools to explore and analyze that deadlock.
mcmini-annotate - annotating the thread sequence with further details
mcmini-gdb - running GDB and stepping forward and back through the transitions
Let us begin with GDB, using mcmini-gdb. We will used the
deadlock.c program from the Quick Start subsection.
Be sure to compile ‘deadlock.c’ with ‘-g3’, for debugging:
> gcc -g3 deadlock.c -o ./deadlock # Copied from the Quick Start subsection
And last time (in “Quick Start”), we ran this as:
./mcmini -f -q -m15 ./deadlock
So, let’s use the same flags, but with ./mcmini-gdb
> ./mcmini-gdb -f -q -m15 ./deadlock
** Generating trace sequence for:
     ./mcmini.git/mcmini -v -q  '-f' '-q' '-m15' './deadlock'
     (This may take a while ...)
** Running: /home/gene/mcmini/mcmini-gdb -m15 -t 0 -t'0, 0, 0, 1, 1, ' ./deadlock
** Note:  In order to replay this trace,
          it is faster to directly run the above command line.
...
About to exec into ./deadlock
...
Thread 2.1 "deadlock" hit Breakpoint 1, main () at deadlock.c:15
15      int main() {
...

List of commands:

mcmini -- mcmini <TAB> : show all mcmini commands
mcmini back -- Go back <count> transitions, by re-executing; default count=1
mcmini developerMode -- Permanently switch GDB to developer environment.  For developers only.
mcmini forward -- Execute until next transition; Accepts optional arg: <count>; or: end
mcmini help -- Prints help for getting started in McMini
mcmini printPendingTransitions -- Prints the next (pending) transition for each thread
mcmini printTransitions -- Prints the transitions currently on the stack
mcmini where -- Execute where, while hiding McMini internal call frames

Type "help" followed by command name for full documentation.
Type "apropos word" to search for commands related to "word".
Type "apropos -v word" for full documentation of commands related to "word".
Command name abbreviations are allowed if unambiguous.

*** Type 'mcmini help' for usage. ***
(Do 'set print address off' for less verbose output.)
(gdb)
So, let’s explore further. Note the comment at Running,
saying that McMini has substituted the following command line.
> ./mcmini-gdb -m15 -t 0 -t'0, 0, 0, 1, 1, ' ./deadlock
Apparently, when we used the -f flag, McMini discovered a trace sequence with just five transitions until deadlock. And the initial McMini output shows that we can run mcmini forward 5, so as to reach this deadlock. But mcmini forward end is easier to type. So, we’ll use that form. Let’s do it.
./mcmini-gdb -m15 -t 0 -t'0, 0, 0, 1, 1, ' ./deadlock
(gdb) mcmini forward end
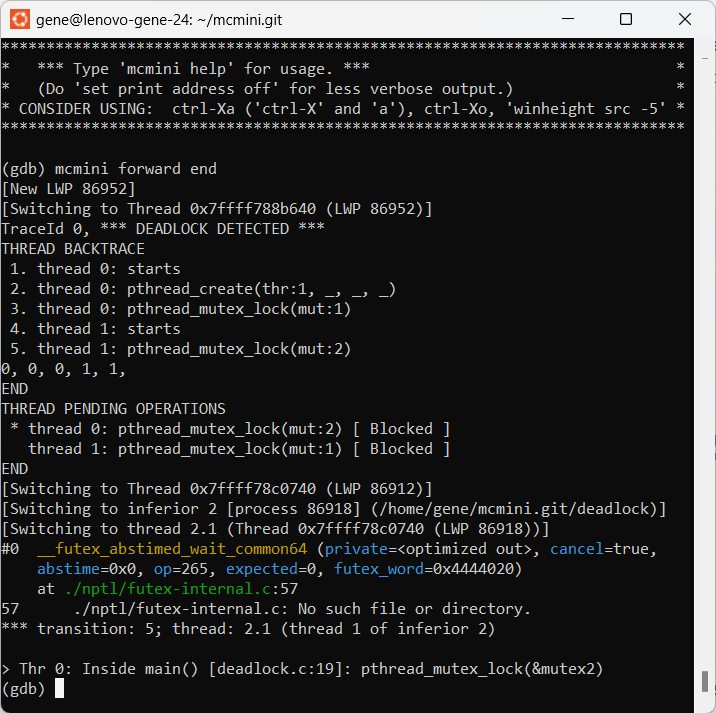
Now, we can see that under “THREAD PENDING OPERATIONS”, both of the threads are “[ Blocked ]”. And the reason is clear. Each of the two mutexes have already been locked, and yet each thread tries to lock the mutex already “owned” by the other thread.
In general, McMini provides a rich set of new GDB commands with prefix
mcmini. And, as usual, GDB provides “tab completion”. So, we
can type mc<TAB> f<TAB> 5 instead of mcmini forward 5.
Each mcmini command jumps forward or backward to the desired
transitions (thread operations). Low-level GDB call frames are hidden,
and only the user’s call frames are shown. For example, “where”
would show all call frames, while “mcmini where” shows only the
user’s call frames.
Now, let’s back up one step to see how this deadlock arose. Further, this time, let’s use the substituted command with the explicit trace sequence, since McMini says that this will execute faster. We now have:
./mcmini-gdb -m15 -t 0 -t'0, 0, 0, 1, 1, ' ./deadlock
(gdb) mcmini forward end
(gdb) mcmini back 1
(gdb) mcmini where
(gdb) mcmini printTransitions
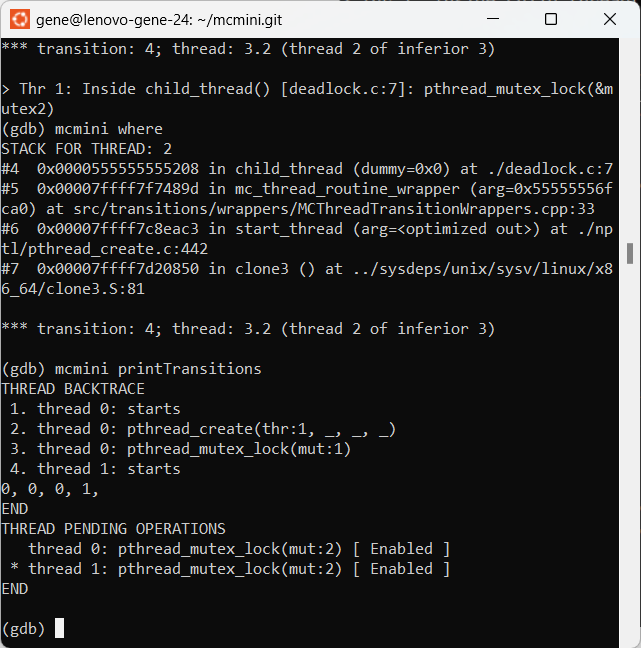
It’s now clear what happened. Thread 0 has locked mutex 1. Both threads are “[ Enabled ]” and trying to lock mutex 2. If Thread 0 locks mutex 2, then everything will be fine. But if Thread 1 locks mutex 2, then we will have the deadlock that we previously saw.
The stack shown by mcmini where
is for Thread 1. This is the case both because
Thread 1 was last executed, and because the display
shows that transition 4 was executed by
“thread 2” in GDB’s numbering scheme.
(It’s unfortunate, but GDB chooses a one-based numbering scheme
for thread numbers, and McMini chooses a zero-based numbering
scheme.)
The stack also shows that Thread 1 is now in its start
function (child_thread()), at line 7 in
deadlock.c.
The asterisk next to Thread 1 under “PENDING
OPERATIONS” indicates that for the
current trace sequence (0,0,0,1,1), Thread 1 will
have the next transition if we execute mcmini forward.
If we wanted to decide what thr:1 and mut:1 refer to
in the source code, we could elucidate by calling
mcmini-annotate with the same arguments as for
mcmini-gdb.
We have hypothesized that since Threads 0 and 1 are both enabled, the deadlock occurs when Thread 1 decides to lock mutex 1, even though that is the next goal of Thread 0. Let’s prove our theory. We’ll play a “what-if” game. Instead of the trace sequence
> -t’0, 0, 0, 1, 1, ‘
let’s try:
> -t’0, 0, 0, 1, 0, ‘
We omit the -t0 flag and specify only the trace sequence prefix, to see all possible traces. It turns out that there is only one trace with this prefix.
Incidentally, I prefer to switch back and forth between GDB’s
test interface and it’s full-screen interface.
So, let’s use GDB’s “layout src” command (also available
as ‘ctrl-Xa’) to provide a full-screen display. You can toggle back
and forth from full-screen to classic view by again typing ‘ctrl-Xa’.
And you can use “focus src” or “focus cmd” (also available
through ‘ctrl-Xo’) to switch the focus on which cursor keys operate,
from the source sub-window to the command sub-window.
Since we’re now using full-screen mode, let’s employ the shorter
McMini command, mcmini printPendingTransitions.
./mcmini-gdb -m15 -t'0, 0, 0, 1, 0, ' ./deadlock
(gdb) layout src # or ctrl-Xa (full-screen view)
(gdb) mcmini forward 5
(gdb) mcmini printPendingTransitions
# (If GDB's 'src' window misbehaves, scroll up with the cursor keys.)
Now, in the world of this alternative trace, we can see that for this prefix, Thread 0 would no no longer be blocked. So, Thread 0 can simply unlock mutex 2.
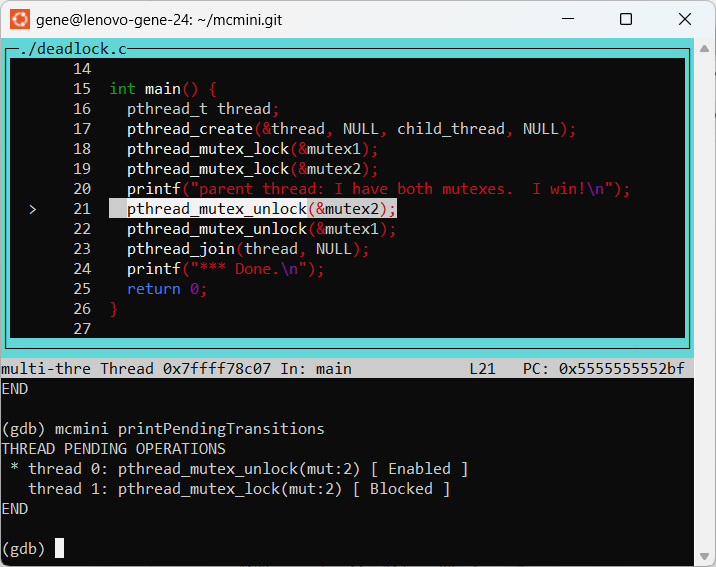
Indeed, if we use the standard mcmini command, we
see a longer trace of 13 transitions,
in which each thread exits successfully.
We set the verbose flag twice for more details: -v -v
% ./mcmini -m15 -v -v -t'0, 0, 0, 1, 0' ./deadlock
...
THREAD BACKTRACE
...
0, 0, 0, 1, 0, 0, 0, 1, 1, 1, 1, 1, 0,
END
THREAD PENDING OPERATIONS
   thread 0: exits [ Done ]
   thread 1: exits [ Done ]
END
Curiously, this is not one of the three canonical trace sequences, as seen by:
% ./mcmini -q -v ./deadlock
... (omitting some lines of the output) ...
TraceId 0:  0, 0, 0, 0, 0, 0, 1, 1, 1, 1, 1, 1, 0,
TraceId 1:  0, 0, 0, 1, 1,
TraceId 2:  0, 0, 1, 1, 1, 1, 0, 1, 0, 0, 0, 1, 0,
*** DEADLOCK DETECTED ***
  (Trace number (traceId): 1)
Alternatively, we can directly grep:
% ./mcmini -q -v ./deadlock 2>/dev/null | grep ^TraceId
TraceId 0:  0, 0, 0, 0, 0, 0, 1, 1, 1, 1, 1, 1, 0,
TraceId 1, *** DEADLOCK DETECTED ***
TraceId 1:  0, 0, 0, 1, 1,
TraceId 2:  0, 0, 1, 1, 1, 1, 0, 1, 0, 0, 0, 1, 0,
Note that this allows us to see all traces in lexicographic order. If you prefer to see trace sequence number X, only, then do:
> mcmini -v -tX ./deadlock
In fact, our new trace is a variant of TraceId 0, above. TraceId 0, above, differs from our trace with prefix 0,0,0,1,0 in that our trace shows a fourth transition executed by thread 1, and in TraceId 0, this has now been delayed until transition 7. But this is the transition in which thread 1 is created. So, it doesn’t matter whether thread 1 is created sooner or later. The canonical variant uses lexicographic ordering to prefer transition 4 being executed by thread 0 instead of thread 1.
We could then explore mixing the built-in GDB commands with
the extended mcmini commands supplied by McMini.
It is perfectly possible to use the usual GDB commands
of print, next, step, continue, finish, and
so on.
(However, currently McMini numbers the threads starting from zero, and GDB
numbers the threads starting from 1. This may be fixed in the future.)
But if we were to explore mixing native GDB and McMini commands, then
this would no longer be a “basic tutorial”. So, we will stop here,
and leave you to discover these additional possibilities.
Review of McMini flags (from the McMini man page):
- -m <num>, --max-depth-per-thread <num>
- -M <num>, --max-transitions-depth-limit <num>
- -f, --first, --first-deadlock
- -a, --all, --all-deadlocks
- -l, --check-for-livelock
- -q, --quiet
- -t <traceId|traceSeq>, --trace <traceId|traceSeq>
- -v, --verbose